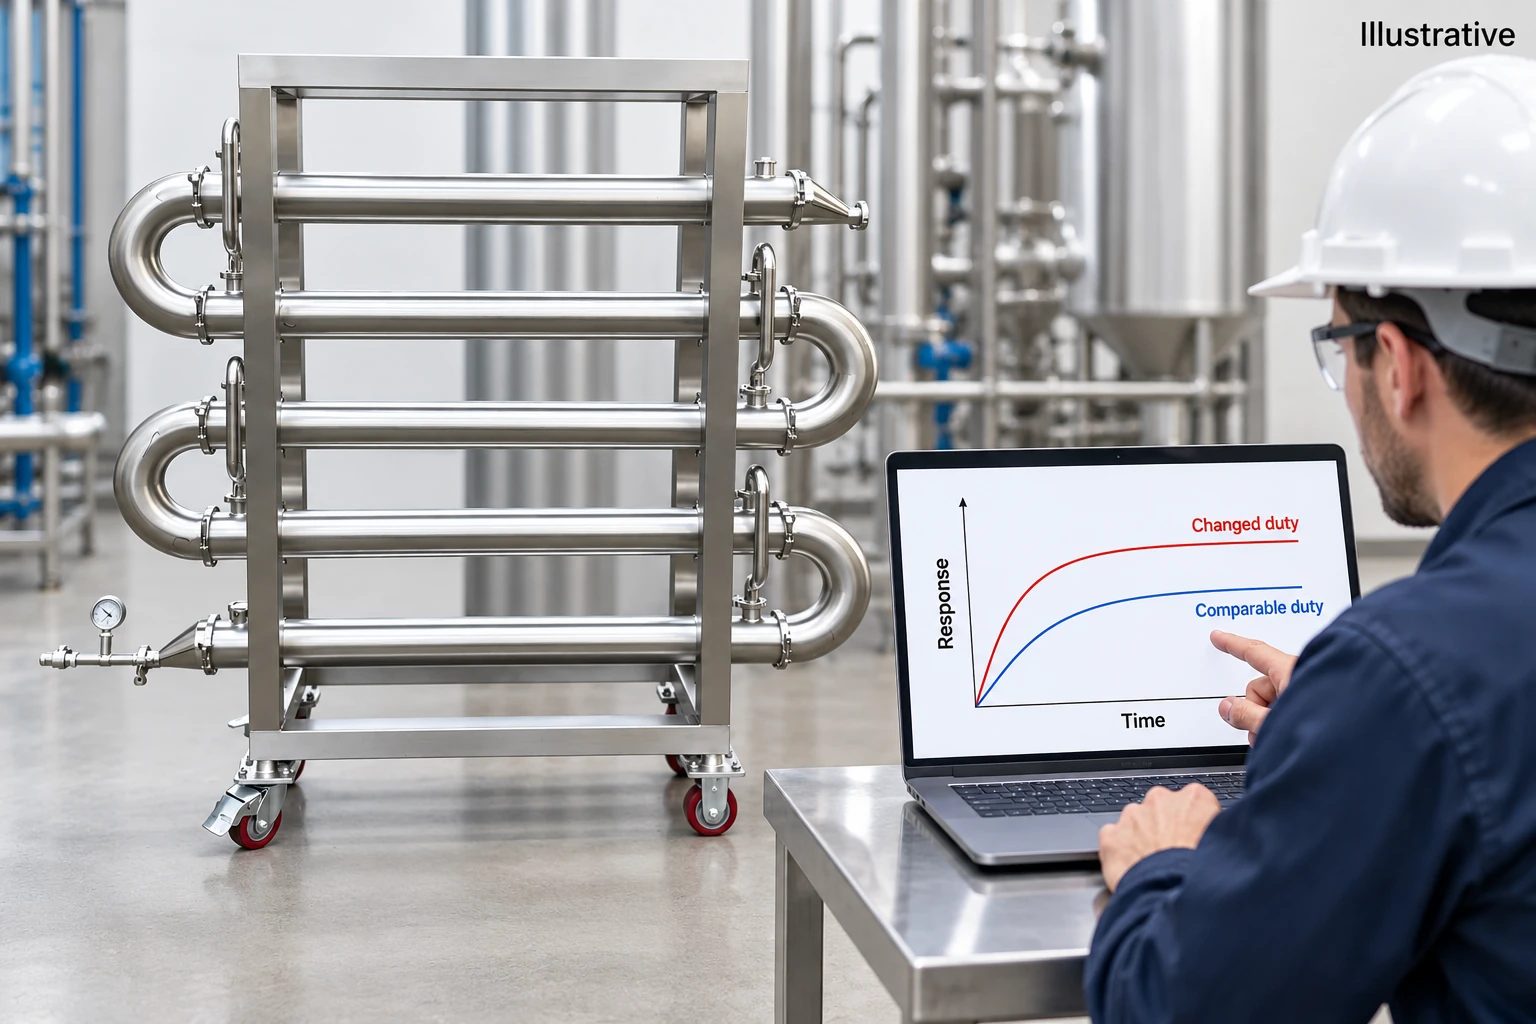
Heat exchanger performance monitoring compares measured thermal and hydraulic behavior with a suitable baseline while accounting for changes in flow, fluid properties, inlet temperatures, and operating mode. A lower outlet temperature or rising pressure drop does not automatically prove fouling. Sensors, utility conditions, control valves, phase behavior, and process demand can produce similar symptoms. Build the monitoring method around verified measurements, an energy balance, a consistent performance calculation, and a decision rule linked to operational consequences. The goal is to distinguish a real deterioration from an ordinary change in duty before cleaning or replacing equipment.
Define what performance means for the process
Start with the required process outcome: heating a product to a target condition, removing a specified load, limiting utility consumption, or maintaining a safe operating temperature. A monitoring system should identify when that outcome is at risk and help explain why. A single displayed efficiency percentage can hide important differences between reduced capacity, poor control, and changing demand.
The existing fouling-resistance guide addresses allowance during sizing. Operating monitoring asks whether measured behavior has changed from a relevant clean or accepted condition. The two are related, but an assumed design fouling factor is not a measured trend or a diagnosis of the current deposit.
Confirm the measurement boundary
Draw the exchanger and identify both flow measurements, inlet and outlet temperature locations, and pressure measurements. Note bypasses, recirculation, drains, vents, and any heat input or loss inside the boundary. A sensor downstream of a mixing tee may measure a combined stream rather than the exchanger outlet. Use the actual installed arrangement, not an idealized diagram.
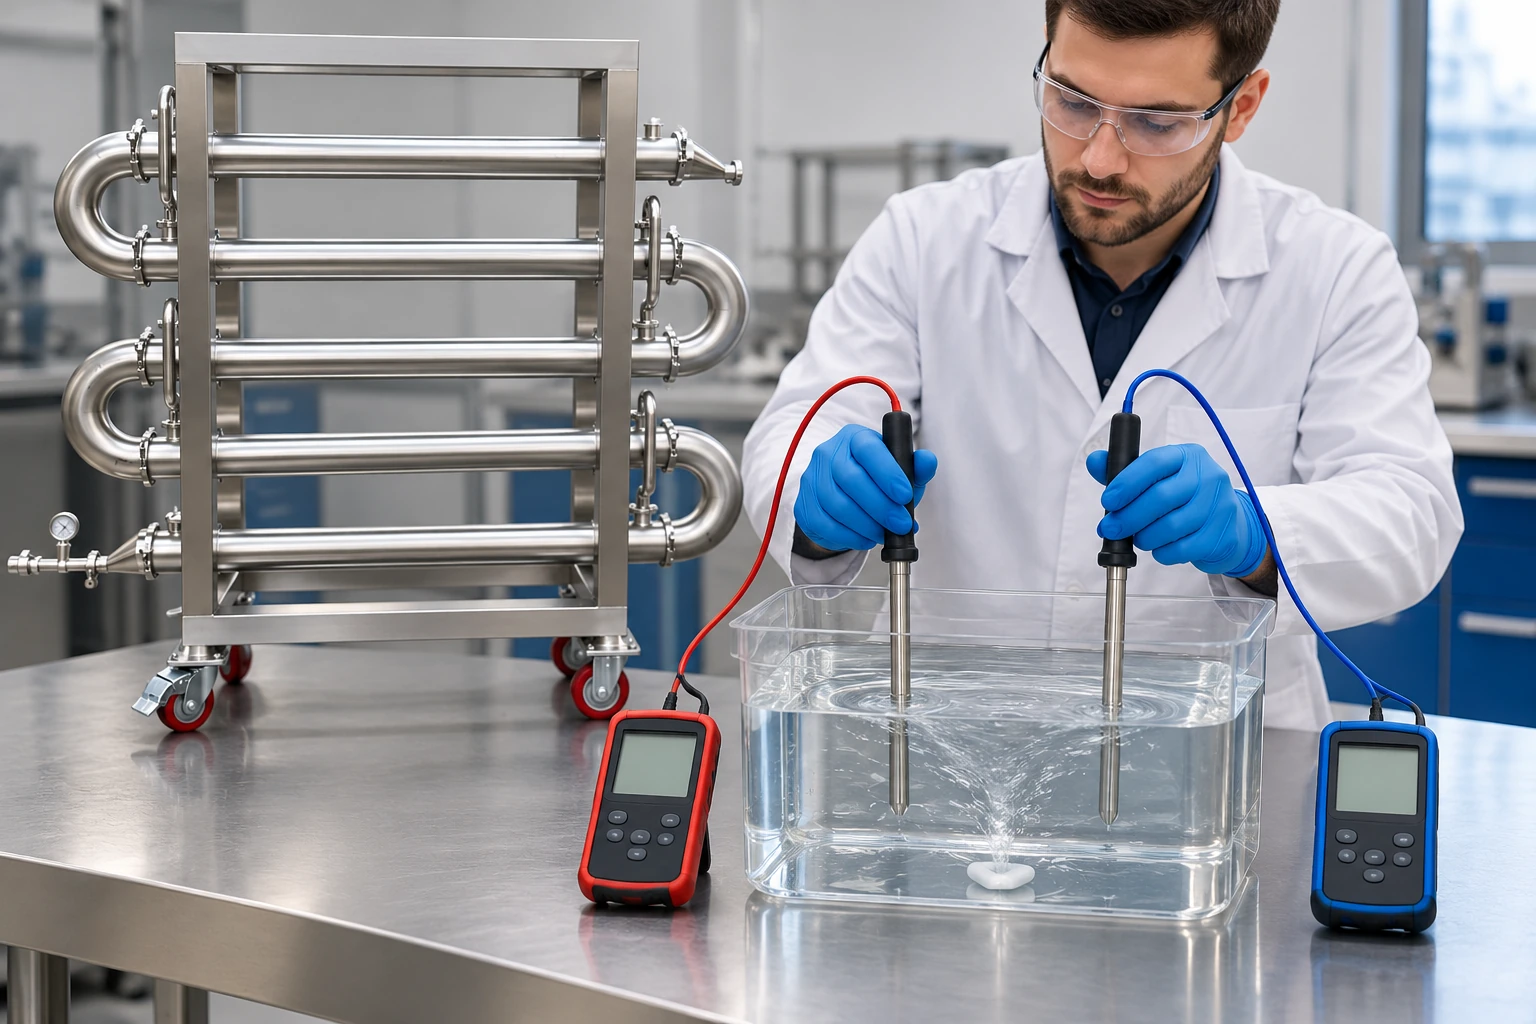
Check sensor identifiers, units, calibration status, and time synchronization. A small offset can matter when the temperature difference is small. Flow measurements need the correct fluid properties and operating range. NIST calibration resources support traceability, but an instrument certificate does not prove that the sensor location represents the required process point.
Establish a trustworthy baseline
Use a stable operating period with known equipment condition, verified measurements, and documented fluid composition. Record whether the exchanger was clean, recently inspected, or accepted through another defined criterion. Do not label the first available data as clean merely because no maintenance record is available. State baseline uncertainty and any missing information.
Capture multiple relevant loads if the process varies widely. A baseline at one flow and temperature may not describe another regime. For batch service, compare equivalent stages of the batch rather than mixing warm-up, steady transfer, and cooldown data. For changing products, group comparable fluid properties and operating conditions before drawing a trend.
Use the energy balance as a data-quality check
For a single-phase stream with approximately suitable constant heat capacity, thermal duty can be estimated as Q = mass flow × heat capacity × temperature change. Use consistent units and properties appropriate to the actual fluid and temperature range. Phase change, strong property variation, or reaction can require a different enthalpy calculation.
Compare the calculated duty on both sides. They need not match perfectly because of measurement uncertainty and heat exchange with the surroundings, but a large unexplained mismatch should be investigated before calculating a precise overall coefficient. Incorrect flow scaling, temperature offsets, unmeasured bypasses, and time lag can all create a false imbalance.
For a hypothetical water-like stream at 2 kilograms per second, using a heat capacity of 4.18 kilojoules per kilogram-kelvin and a 10-kelvin rise gives about 83.6 kilowatts. The numbers illustrate unit handling only. Use verified properties for the actual fluid; the example is not a product rating or an accuracy claim.
If independent samples indicate possible contamination, use a separate cross-contamination investigation; a calculated coefficient change cannot by itself release or condemn affected product.
Calculate an apparent overall coefficient carefully
Where the chosen exchanger model is appropriate, Q = U × A × F × LMTD. Here U is the overall heat-transfer coefficient, A the area on the stated basis, F an applicable correction factor, and LMTD the logarithmic mean temperature difference. Rearranging gives an apparent U from measured duty. State the area basis, model, and assumptions.
The NPTEL heat-exchanger teaching material provides the thermal-design background. The LMTD versus effectiveness-NTU guide explains when different calculation approaches are useful. Neither removes the need to verify that the model fits the installed flow arrangement.
An apparent U can fall because flow or fluid properties changed, even without new deposits. Very small terminal temperature differences can also make the calculation sensitive to sensor error. Flag unreliable conditions rather than presenting every calculated point as equally meaningful. Keep the underlying measurements available for review.
Compare like operating conditions
A practical first step is to trend performance within defined ranges of flow, composition, and temperature. More advanced normalization can use a validated model, but its assumptions and error must be understood. Do not create a correction formula simply to make all historical points line up. A fitted trend can conceal real deterioration if the model is adjusted without independent evidence.
| Monitoring signal | What it can suggest | Additional check before diagnosis |
|---|---|---|
| Lower duty at comparable conditions | Thermal resistance or reduced effective area | Sensor quality, bypass and utility conditions |
| Higher pressure drop at comparable flow | Restriction or changed fluid properties | Viscosity, valve position and measurement locations |
| Falling apparent U | Changed heat-transfer behavior | Flow regime, properties and calculation sensitivity |
| Hot-side/cold-side duty mismatch | Measurement or boundary problem | Timing, flow scaling, heat losses and unmeasured streams |
| Unstable outlet temperature | Control or supply instability | Valve behavior, utility pressure and batch stage |
| Changed approach temperature | Different load or exchanger condition | Inlet temperatures, flows and comparison basis |
These are diagnostic directions, not definitive causes. Choose actual investigation limits from process needs, measurement uncertainty, and experience with the equipment. The LearnChemE heat-transfer resources provide neutral educational context for these relationships.
Use pressure drop alongside thermal trends
Compare pressure drop at relevant flow and fluid conditions. A change can arise from deposits, but also from a valve, a partially blocked strainer, a different product, or an instrument problem. Confirm that pressure taps measure the exchanger rather than an extended piping route with changing restrictions. Review elevation and density effects where they matter.
The shell-and-tube pressure-drop guide provides complementary hydraulic considerations. A combination of worsening thermal performance and rising pressure drop can strengthen a fouling hypothesis, but some deposits affect heat transfer with little measurable restriction. Absence of a pressure-drop change does not prove the surfaces are clean.
Turn trends into a maintenance decision
Define the cost or consequence of continued operation: lost production, utility use, failure to reach a process condition, or increasing risk. Compare that with the cost and risk of cleaning or inspection. A fixed calendar can be useful, but trend-based decisions need a documented threshold and an action owner. Do not let a dashboard alert become a substitute for engineering judgement.
When cleaning is performed, preserve the pre-cleaning data and compare the subsequent result under similar conditions. A recovered thermal trend supports the deposit explanation, while little improvement suggests another cause or ineffective cleaning. Record the cleaning method and equipment condition so later comparisons remain meaningful. Avoid changing the baseline automatically after every intervention.
Handle batch and transient data separately
During warm-up, energy accumulates in the fluid and metal rather than immediately leaving in another measured stream. A steady-flow balance may therefore be unsuitable. Define whether the calculation is intended for a stable transfer period or whether a transient model includes stored energy. Record batch mass, initial condition, and the selected time interval. Comparing the first minutes of one cold batch with a later stage of another can create an apparent deterioration that is actually a timing difference. Align the comparison with a meaningful process stage before assigning a maintenance action.
Keep the monitoring system maintainable
Provide clear definitions for each calculated signal, its units, valid operating range, and excluded periods. Flag missing or suspect data visibly. An attractive continuous curve can mislead when it silently fills gaps or averages away short events. Retain raw data alongside summarized trends and document any filtering.
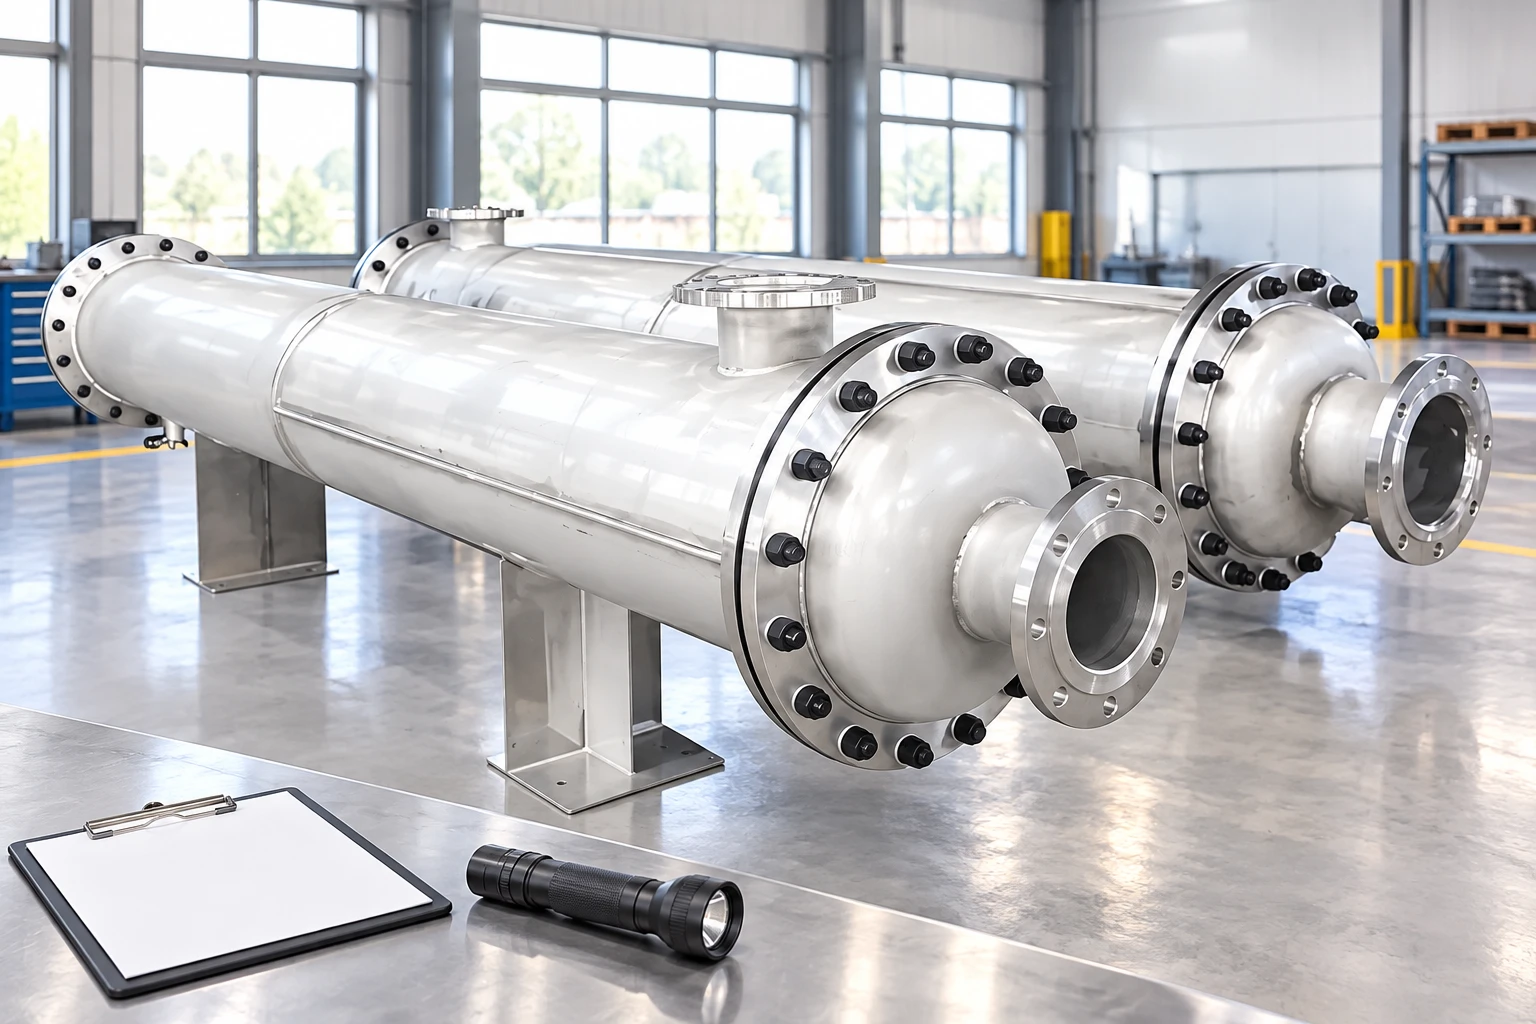
For a tubular heat exchanger, specify the measurement locations, required operating cases, available area and configuration data, and acceptance evidence. Product photographs do not establish thermal duty, sensor accuracy, or an installed monitoring capability. Ask for the information needed to connect design expectations with actual operating measurements.
Further learning: exchanger simulation
The following educational simulation shows how flows and inlet conditions affect exchanger behavior. It helps explain why an operating trend needs a consistent comparison basis before deterioration is assigned to fouling.
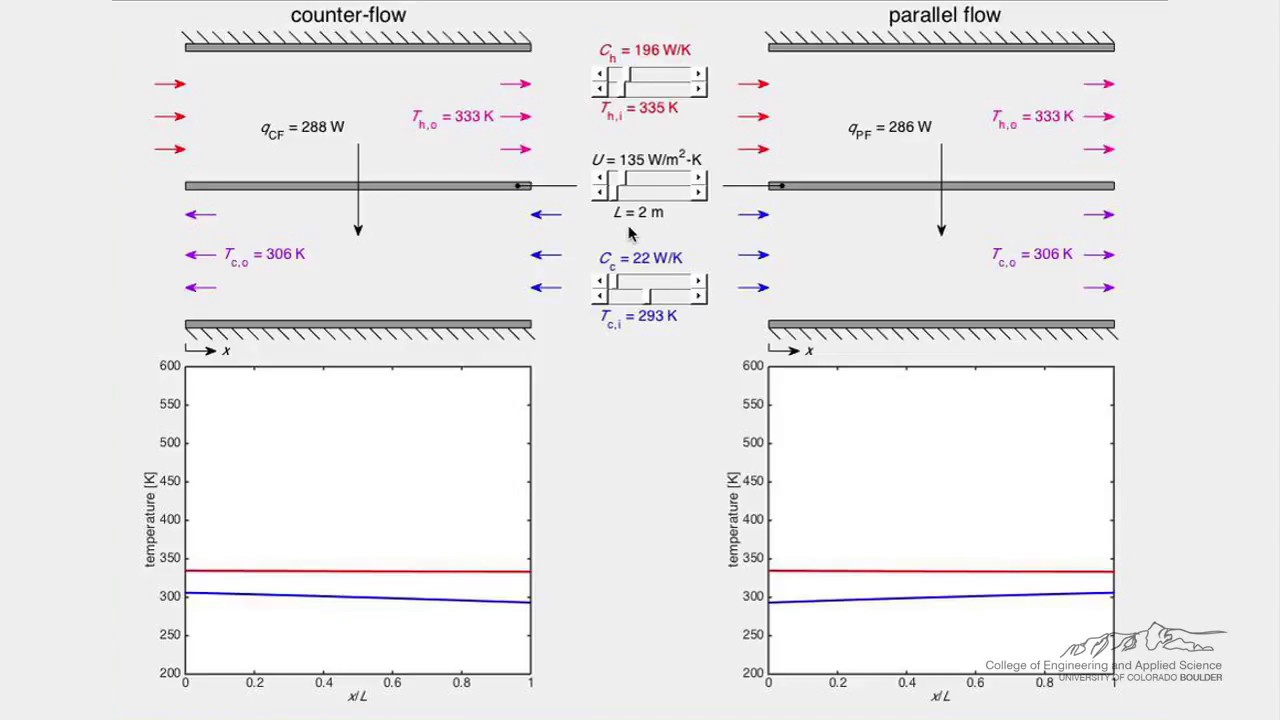
Watch Heat Exchanger (Simulation) by LearnChemE
FAQ
Does a falling outlet temperature prove fouling?
No. Changes in inlet conditions, flow, properties, utility supply, control behavior, or measurements can produce the same symptom. Compare the full thermal and hydraulic evidence.
Can I trend U without checking both energy balances?
You can calculate a number, but its reliability is uncertain. Investigate significant unexplained duty imbalance before treating the calculated coefficient as a performance diagnosis.
Should the baseline reset after cleaning?
Only after the equipment condition and measurements are verified and the comparison conditions are documented. Preserve the previous baseline so the maintenance effect remains reviewable.