Fermenter off-gas respiratory quotient is the ratio of carbon dioxide evolution to oxygen uptake, expressed on a consistent molar basis. It can help describe culture activity, but a calculated number is only useful when gas composition, flow, timing and calculation assumptions are valid. A sudden change may reflect the process, the sampling system or the calculation itself. Before using an RQ trend to investigate a batch, establish what the instruments actually measured and how those measurements were converted into rates. This guide focuses on measurement review and purchasing requirements, rather than prescribing a universal RQ target or feed-control strategy.
Distinguish gas fractions, rates and the quotient
An oxygen analyser may report a gas fraction, such as molar percent. Oxygen uptake rate, OUR, expresses oxygen consumed per unit time. Carbon dioxide evolution rate, CER, expresses carbon dioxide produced per unit time. The respiratory quotient is CER divided by OUR. Dividing the outlet carbon dioxide percentage by the outlet oxygen percentage does not produce the same quantity because it ignores the inlet streams and gas flow.
Itu University of Maryland biochemical-engineering example introduces OUR, CER and RQ using a fermentation balance. Its particular organism, substrate and reaction assumptions are an educational example, not operating settings for another culture. Record the definitions used in your software before comparing results from two systems that both display a field labelled “RQ.”
Draw the complete gas boundary
List all gas streams entering the process boundary: air, oxygen enrichment, nitrogen or other intentional additions where relevant. Identify where the exhaust sample is taken and whether the measured flow represents the entire outlet or a sample branch. Record condensers, filters and other components between the vessel and the analyser. A process drawing and a photograph of the actual sampling route are more useful than an assumed generic arrangement.
Check whether any bypasses, vents or sample returns cross the boundary. If an unmeasured stream can carry oxygen or carbon dioxide, the simple balance may not close. Document its significance with the process engineer rather than quietly ignoring it. The related fermenter exhaust-gas handling guide covers containment and equipment arrangement; the purpose here is to establish a defensible measurement boundary.
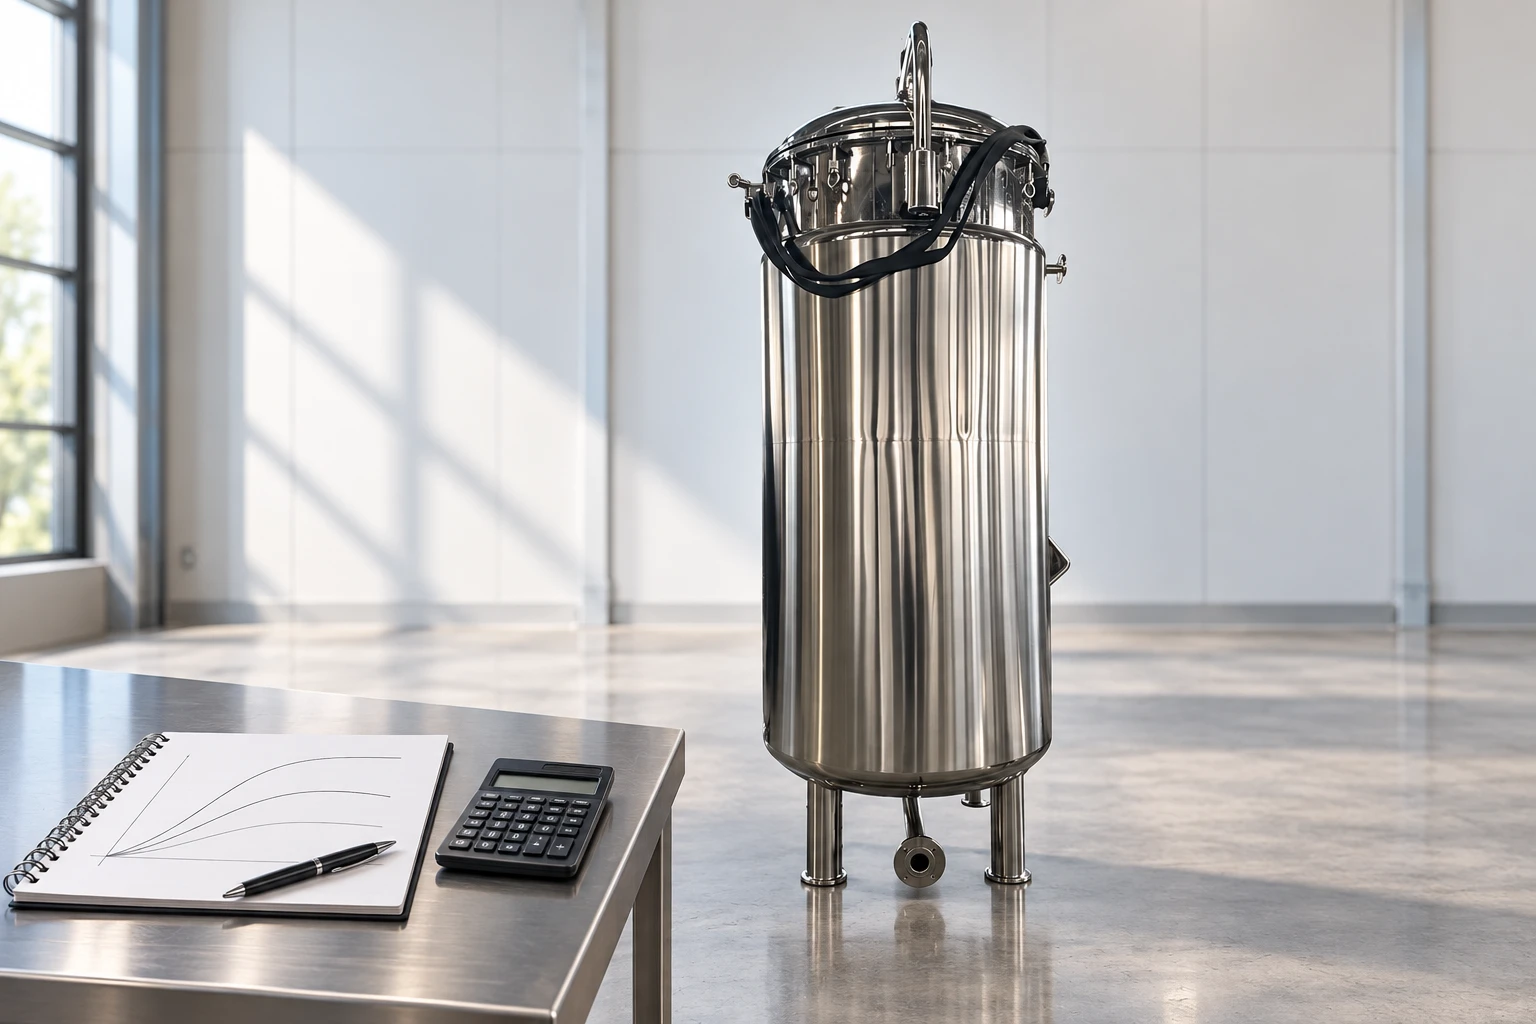
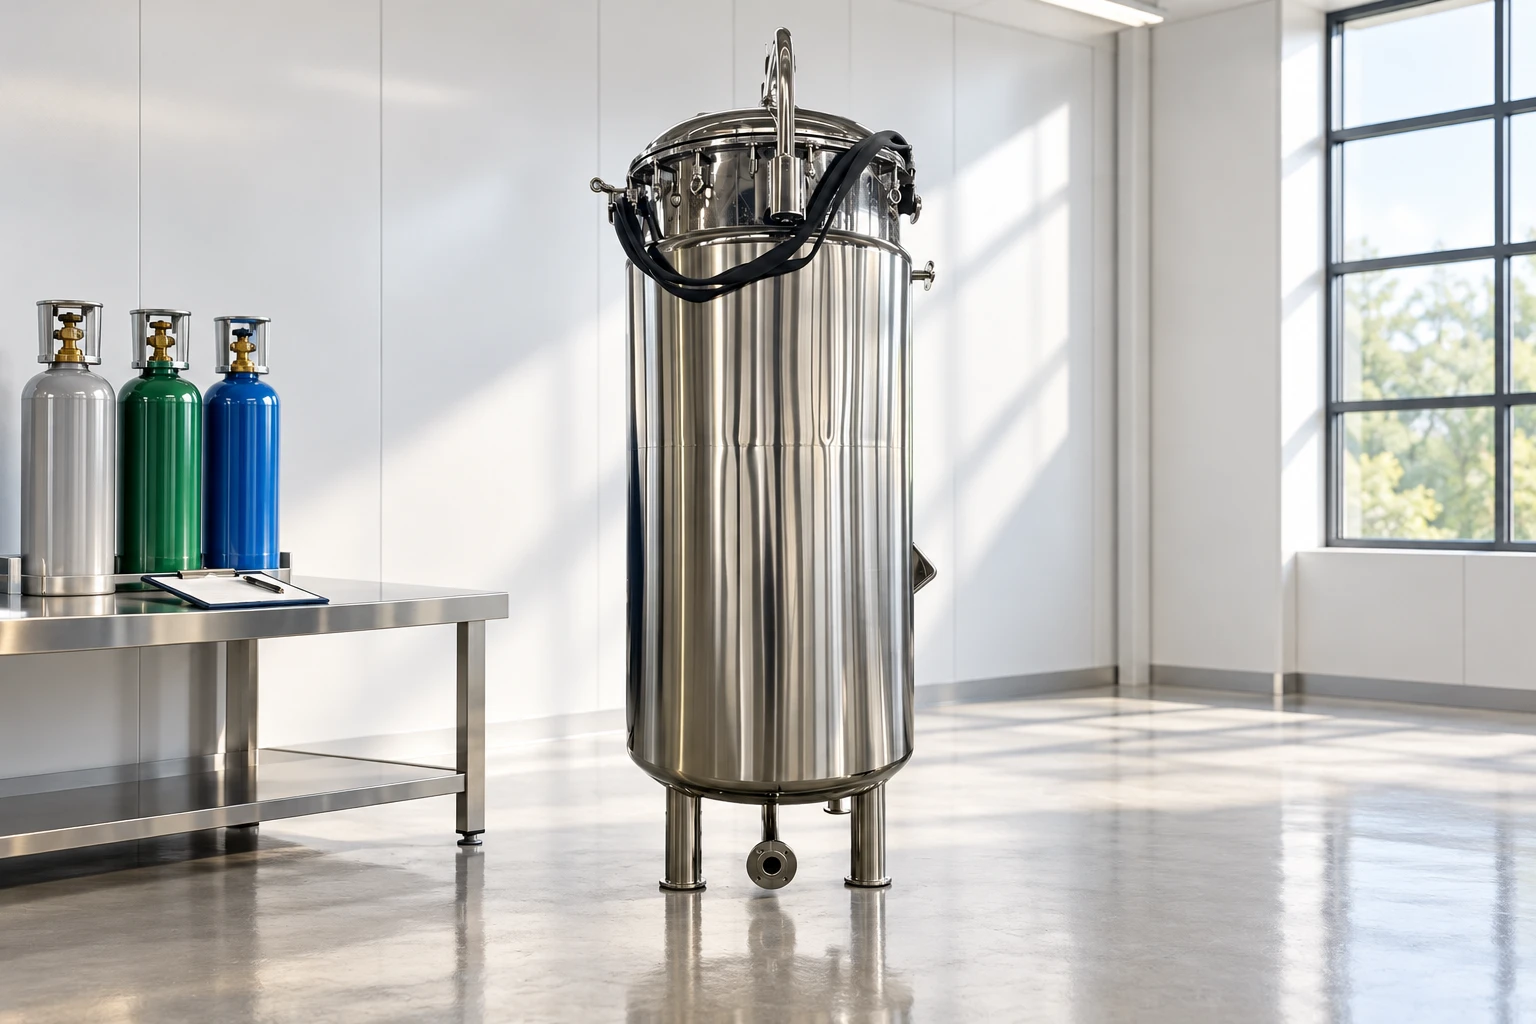
The illustration shows the reference fermenter beside a separate calculation workspace. It does not establish that this model includes an off-gas analyser or the depicted optional monitoring equipment.
Put flow and composition on the same basis
For a simple quasi-steady gas balance, define F as total dry molar gas flow and y as dry molar fraction. Then an apparent oxygen consumption rate from the gas balance is:
OUR_app = F_in × y_O2,in − F_out × y_O2,out
Similarly, an apparent carbon dioxide production rate from the gas balance is:
CER_app = F_out × y_CO2,out − F_in × y_CO2,in
RQ_app = CER_app / OUR_app
If F is in mol/min, each rate is in mol/min and RQ is dimensionless. Multiple inlet streams require summing their contributions. These equations assume that the stated boundary and corrections are appropriate; they are not a substitute for a validated dynamic model. An apparent gas-transfer rate should not automatically be equated with the instantaneous metabolic rate in a rapidly changing system.
Do not mix standard litres with actual litres, dry fractions with wet fractions, or percentages with decimal fractions. Record the reference temperature and pressure for volumetric flow. Ask the supplier how outlet flow is determined and which assumptions are made if it is inferred rather than measured. An inert-gas balance needs its own validated assumptions and cannot be adopted solely because it makes the displayed numbers look plausible.
Work through a transparent arithmetic example
Consider an illustrative dataset already converted to consistent dry molar flows. The inlet is 1.00 mol/min with oxygen fraction 0.210 and carbon dioxide fraction 0.0004. The outlet is 1.00 mol/min with oxygen fraction 0.180 and carbon dioxide fraction 0.0304. The oxygen term is 0.210 − 0.180 = 0.0300 mol/min. The carbon dioxide term is 0.0304 − 0.0004 = 0.0300 mol/min. The apparent quotient is therefore 0.0300/0.0300 = 1.00. The remaining gas fraction is 0.7896 on both sides, so this simplified example also preserves the non-reacting gas balance.
These are invented teaching inputs, not observed product performance, a recommended recipe or an acceptance range. The example demonstrates why both flows and both compositions matter. If the input basis, boundary or measured outlet flow is wrong, an arithmetically correct answer can still be physically misleading. Keep the unrounded rates available for review instead of retaining only the final quotient.
Review the sampling chain before blaming the culture
Check the sample-point identity, sample transport route, conditioning arrangement, analyser settings and timestamps. Record maintenance, filter changes, calibration and interruptions. Ask which components can affect the sample reaching the analyser and how those effects are controlled or tested. Avoid assuming that the analyser measures the vessel headspace at the same instant that its data record is timestamped.
Use a troubleshooting record that links each suspected issue to a test. “Check analyser” is too vague. Specify what will be challenged, which reference or comparison will be used and how the result will affect interpretation. Keep the manufacturer’s approved procedures for any gas handling or calibration work, including appropriate safety precautions for the gases involved.
| Observation | First question to investigate | Bukti yang harus disimpan |
|---|---|---|
| RQ changes after a sampling-system service | Did the measurement chain change? | Service record, component identity and before/after verification |
| Quotient fluctuates when oxygen uptake is very small | Is the denominator reliably distinguishable from uncertainty? | Raw rates, uncertainty basis and validity flag |
| Trend shifts when inlet gas composition changes | Were all inlet contributions updated? | Gas settings, measured or specified composition and calculation revision |
| Two analysers disagree | Are their gas basis, sample location and timing comparable? | Side-by-side configuration and aligned raw data |
| CO2 trend changes during pH adjustments | Could gas transfer and dissolved-carbon effects contribute? | pH, dosing, gas data and the relevant interpretation limits |
| A sharp event appears in only the derived value | Did data alignment or calculation processing create it? | Raw timestamps, processing settings and recalculated results |
The table is a diagnostic plan, not a list of unique causes. Several effects can coexist, and each should remain a hypothesis until tested.
Account for timing and changing dissolved gas inventories
Compare the timing of feed events, gas changes, agitation changes, pH adjustments and sample measurements. Document transport delay and instrument response as appropriate to the installed system. When combining oxygen, carbon dioxide and flow records, preserve the original timestamps and make any alignment step reproducible. A convenient spreadsheet row number does not prove the values describe the same process interval.
A published study of off-gas analysis in fed-batch mammalian cell culture discusses how bicarbonate, dissolved carbon dioxide and process additions can complicate interpretation. Its biological system differs from microbial fermentation, so its reported rates and settings are not transferable operating targets. The practical lesson is to examine the calculation assumptions and distinguish biological production from other contributions. For dynamic control, seek a model appropriate to the actual culture and equipment.
Flag invalid or uncertain values explicitly
When OUR approaches zero, dividing CER by a small or uncertain denominator can generate a large, unstable quotient. Agree on a validity rule based on the measurement system and process purpose. Do not invent a universal cutoff or hide the issue by clipping the displayed RQ to a visually comfortable range. A flagged interval can be more useful than a precise-looking unsupported number.
Distinguish missing data, invalid data and valid observations outside an expected pattern. Keep the raw measurement and the derived value with their quality flags. If a calculation is revised, retain its version and identify which historical periods were reprocessed. This allows the team to decide whether a trend changed because the process changed or because the calculation was corrected.
Interpret patterns against the batch record
Review the quotient alongside the individual rates, culture stage, substrate additions, biomass or product measurements and other relevant observations. The same quotient can arise from very different absolute rates. Likewise, a changing quotient does not uniquely identify contamination, substrate depletion or oxygen limitation. Treat it as a prompt for investigation within the validated process context.
Itu oxygen-transfer guide addresses a related but distinct engineering question. RQ is not a replacement for dissolved-oxygen measurements, a direct measurement of product concentration or a standalone harvest decision. When evaluating a batch endpoint, connect the gas evidence to the criteria documented in the fermentation harvest assessment.
Learn the biological ratio without importing a universal setpoint
The Khan Academy video below explains the biological meaning of respiratory quotient and why substrate metabolism matters. Its teaching context is biology, not the commissioning of an industrial gas analyser. It supports understanding the numerator and denominator; it does not validate a fermenter’s sampling arrangement or provide control settings for a specific organism.

Use this distinction when training operators. People should understand both the meaning of the ratio and the limits of the installed measurement. A process-specific explanation should identify which conditions make the trend useful, when it should be flagged and what additional evidence is required before changing a batch operation.
Specify the monitoring scope before requesting a quotation
Untuk sebuah fermenter procurement discussion, state whether off-gas analysis is an existing plant system, an optional instrument package or a future integration requirement. Do not assume it is included because a product page lists control sensors. Provide the organism and process context, gas-stream description, required data interface and intended use of the result.
Request documented measurement ranges, calibration methods, sample requirements, response characteristics, gas-basis definitions, calculation equations and raw-data export. Ask who validates the sampling system and who owns the derived calculation. Separate instrument supply, mechanical integration, data configuration and process acceptance in the scope. Before procurement acceptance, agree on tests that demonstrate the entire measurement chain, rather than merely showing that the display turns on.
Pertanyaan yang sering diajukan
Can RQ be calculated by dividing outlet CO2 percentage by outlet O2 percentage?
No. A gas-balance calculation must account for inlet and outlet contributions and consistent flow and composition bases. Outlet percentages alone do not represent carbon dioxide evolution and oxygen uptake rates.
Does a higher RQ prove that a batch is contaminated?
No. Investigate the raw rates, calculation validity, culture stage, sampling system and independent batch observations. A quotient change does not uniquely identify a biological cause.
Is a gas analyser included with every fermenter?
No. Confirm the actual supply scope, sampling arrangement, calibration, calculations and data integration in the quotation. A general reference to process sensors does not establish an included off-gas monitoring package.