A mixing tank tracer test is useful only when its concentration readings and sampling times are trustworthy. Before using a curve to accept a batch or compare agitators, check the tracer calibration, temperature response, sampling location, sample-line delay, timing definition, and repeatability. These checks establish whether an apparent change represents the liquid or the measurement system. They do not supply a universal mixing-time limit. This guide focuses on the quality of the test data; use the separate blending-tank mixing-time guide for the broader operating-envelope and blend-time evaluation.
Define the decision the measurements must support
State the decision before collecting samples. You might need to distinguish two addition methods, confirm that a slow location has reached an agreed concentration band, or check whether a release sample represents the batch. Each decision creates different requirements for timing resolution, instrument response, sample locations, and repeat runs. A precise-looking chart cannot repair an undefined acceptance question.
Record what a successful result would establish and what it would leave open. A soluble tracer can assess concentration distribution under defined conditions. It cannot independently qualify powder dissolution, particle-size distribution, emulsion stability, reaction completion, or hygienic status. Keep those quality attributes in their own verified methods rather than treating one attractive response curve as evidence for the whole process.
Before choosing trial conditions, confirm the verified low-level operating envelope so measurement quality is not confused with operation outside an approved fill range.
Calibrate in the relevant measurement matrix
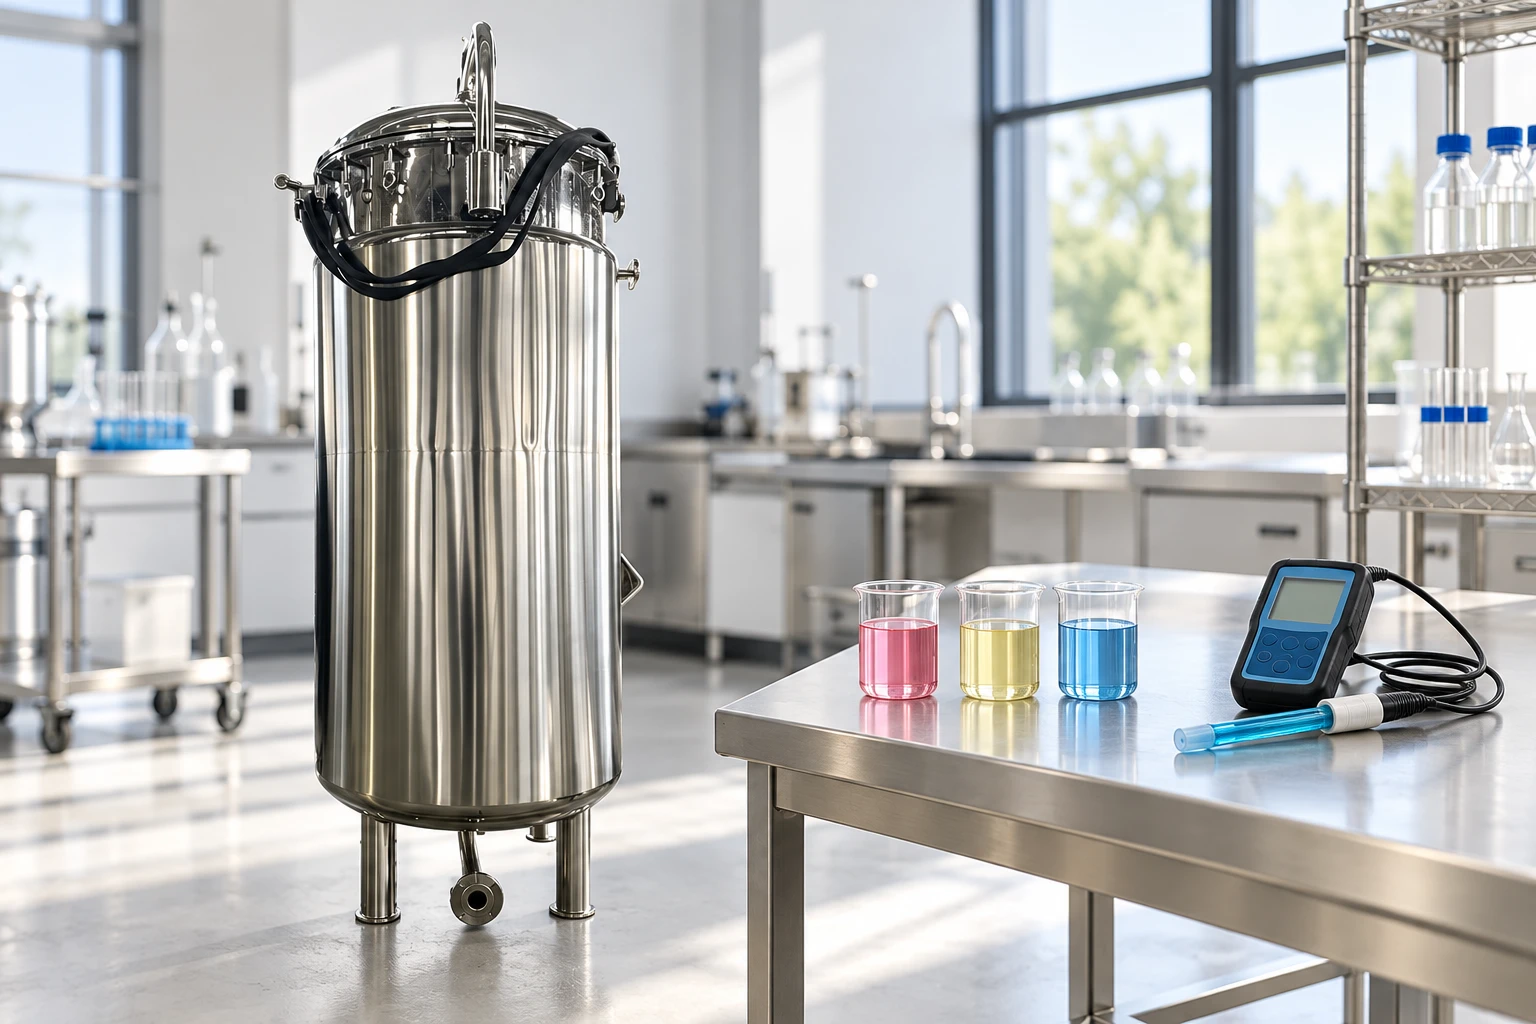
Select a tracer and measurement method that are compatible with the test liquid, equipment, disposal route, and intended use. If conductivity is chosen, establish a suitable relationship between concentration and signal over the actual range. Background salts and temperature can change that relationship. A calibration made in clean water may not transfer directly to another matrix.
Prepare independent reference samples around the range that matters to the decision. Record their preparation, equipment, units, temperature, and handling. Check whether the response is sufficiently repeatable and whether a linear relationship is justified. A calibration curve should describe the data, not force a convenient line through a range where the response behaves differently.
NIST calibration information provides the broader measurement and traceability context. Traceability does not mean that every application of a calibrated instrument is automatically valid. The sensor, reference preparation, field installation, and sampling method still have to be suitable for the specific comparison.
Separate temperature response from concentration response
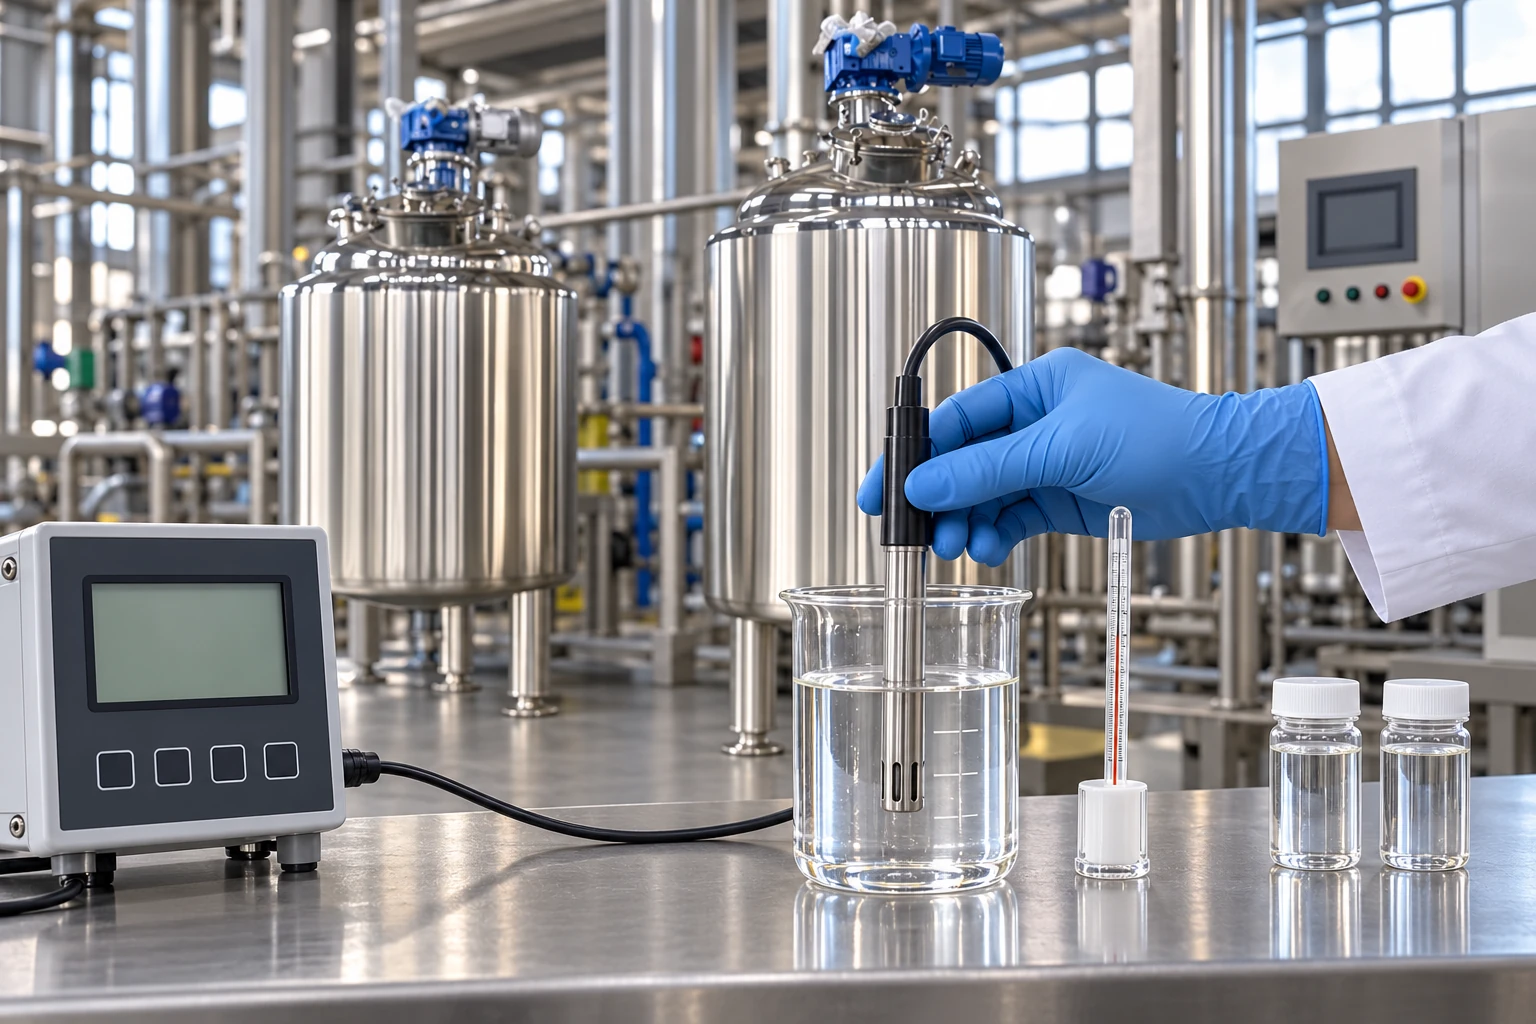
Allow the sensor and sample to reach the condition required by the method. Record temperature independently where it is material. Automatic compensation uses a model; it does not demonstrate that the model is appropriate for every chemical mixture. A temperature change during a test can therefore resemble a concentration change even when the indicated value looks stable.
Check a blank and a reference sample before and after an important run. If their responses move, preserve the original measurements and investigate the drift. Do not silently redefine the final concentration to make a drifting series appear uniform. A later correction needs a documented basis and should remain distinguishable from the originally observed values.
Keep sampling and transport delays visible
Identify where the sample leaves the tank and when the instrument measures it. A sample drawn through tubing reaches the sensor later than the corresponding material passed the sampling point. The line can also broaden a rapid change because of internal mixing, retained liquid, or variable flow. A clock attached to the recorder does not remove those effects.
For an idealized example, 0.030 litres of liquid held in a sample line at a steady 0.15 litres per minute represents a nominal residence time of 0.20 minutes, or 12 seconds. Real line response can differ because of dispersion and the actual flow pattern. These hypothetical values illustrate why line volume and sampling flow belong in the record; they are not a correction to apply automatically.
Record the sampling route, its preparation, flow behavior, and any response check. If the delay cannot be established adequately, report that limitation. Avoid subtracting an uncertain number from every timestamp and then claiming a more accurate blend time. Consistent SI units help prevent an additional error when converting line volume, flow and elapsed time.
Treat sample location as part of the result
A reading close to a well-circulated region can settle before another region does. The measurement represents its location and sampling route; it is not automatically a whole-vessel value. Record height, radial position, and relation to the addition point, impeller and obstructions using an approved drawing or layout record.
Interpret local curves in the context of the sampling position and the mixing arrangement. Do not select the fastest responding point as the acceptance location simply because it produces a short and repeatable time.
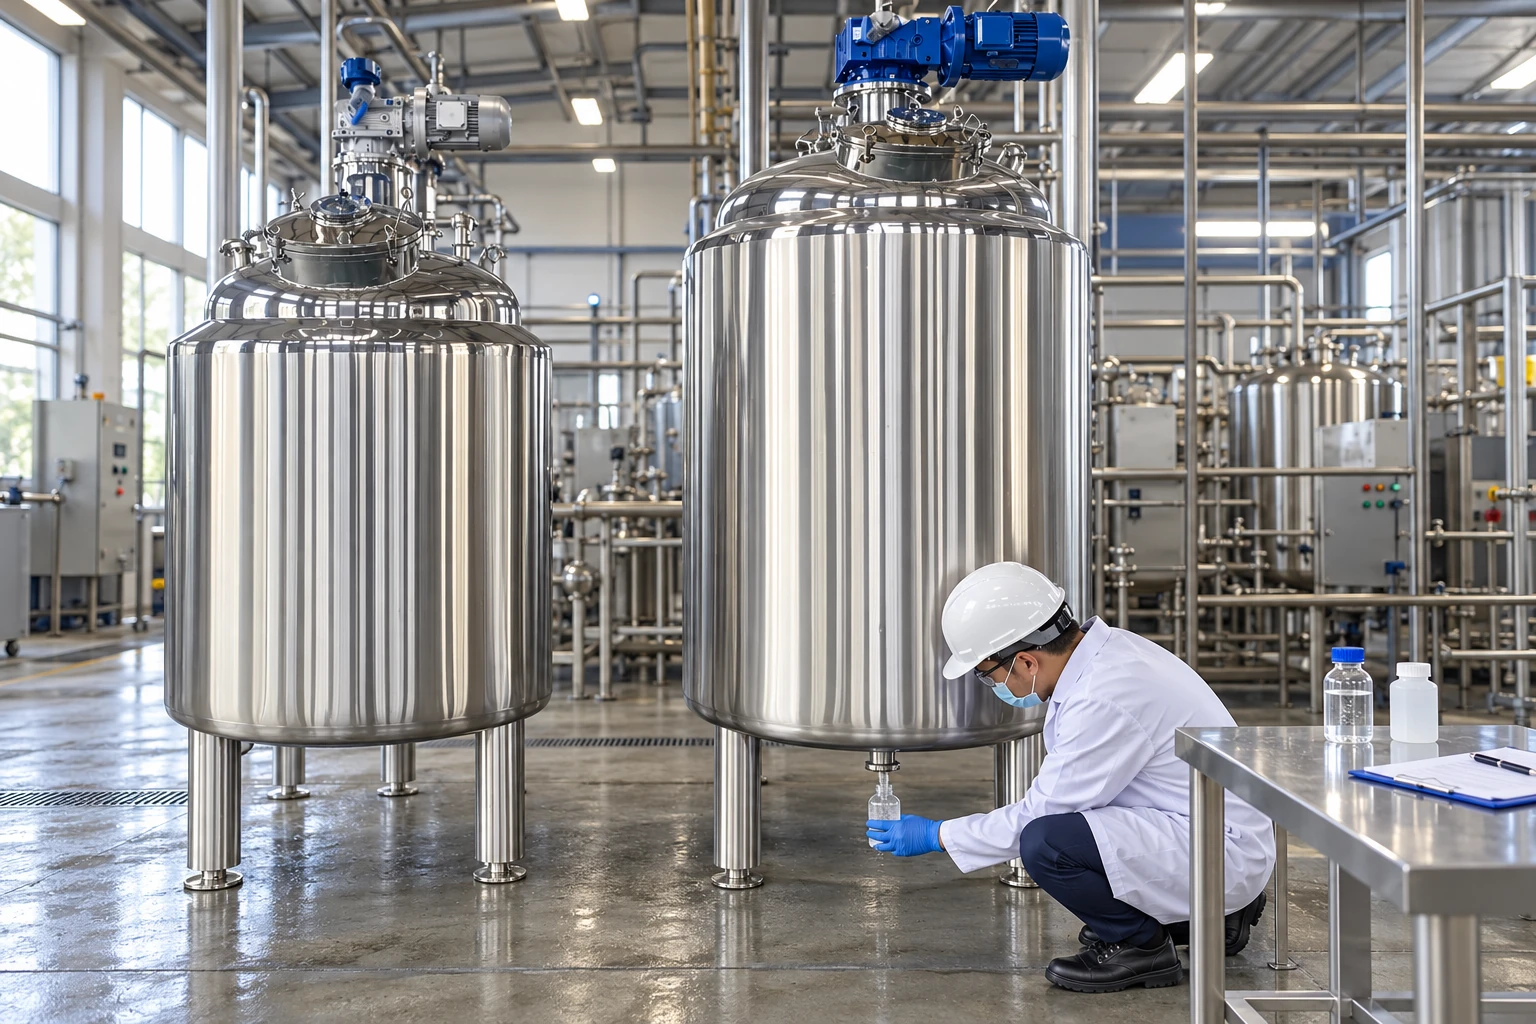
An existing bottom outlet can support a defined sample collection step, but it does not prove access to every relevant region. Plan representative sampling through designed, approved arrangements. Do not open a running vessel or insert a probe past a guard to improve apparent coverage. If a location cannot be measured safely, preserve that gap in the conclusion.
Match timing resolution to the comparison
Define whether time zero is the start or completion of addition, and record addition duration. A slow feed cannot be treated as an instantaneous pulse without a justified model. Synchronize instruments and operator records when more than one device contributes to the result. Otherwise, a clock offset can resemble a delayed concentration response.
Choose a recording interval that can resolve the change of interest. If the proposed improvement is comparable to the sampling interval or timestamp uncertainty, the data may not support that claim. Retain the unfiltered series and document any averaging or smoothing. Filtering can make a noisy curve easier to read while also shifting or hiding short excursions.
Build a practical measurement-quality checklist
The following checklist identifies evidence needed before interpretation. It contains no universal numerical acceptance limits; those depend on the process decision and the demonstrated capability of the method.
| Measurement issue | Evidencia a conservar | Interpretation risk if missing |
|---|---|---|
| Tracer response | Matrix, preparation, range and calibration results | Signal change mistaken for known concentration |
| Temperatura | Reference and sample temperatures, compensation basis | Thermal drift mistaken for mixing behavior |
| Sample route | Location, line volume, flow and response check | Transport delay mistaken for slow tank circulation |
| Time origin | Addition start, finish and clock alignment | Two runs compared on different timing definitions |
| Spatial coverage | Approved location map and access limitations | A local stable reading called whole-batch uniformity |
| Repetibilidad | Individual runs and recorded deviations | One favorable run treated as a robust result |
| Data processing | Raw series, filters and calculation version | Processing choices hidden inside a smooth chart |
A completed checklist is evidence of preparation, not an automatic pass. Resolve omissions that matter to the decision and identify the remaining limitations explicitly. The mixing-tank level-measurement guide provides complementary information about the difference between an instrument indication and the physical quantity it is intended to represent.
Use repeat runs to investigate variation
Repeat relevant conditions with the same documented addition and sampling method. Compare the individual curves before calculating a summary. Large variation can arise from an inconsistent injection, a changing liquid condition, sensor behavior, or a different starting concentration distribution. Repetition alone does not identify which explanation is correct.
Change one factor at a time during investigation where practical. For example, compare a known reference sample before changing agitator speed. Confirm sample-line flow before moving an instrument. This sequence helps avoid assigning an improvement to the tank when it actually came from correcting the measurement setup.
Keep unusual runs. Label an interrupted addition, a blocked sample route, or a temperature excursion and explain its treatment. Deleting an inconvenient series without a documented reason makes the remaining result difficult to trust. A repeat that follows a correction is new evidence, not a replacement for the history of the original run.
Apply the agreed decision rule at the boundary
Measurement uncertainty matters most when a result sits near the acceptance boundary. Suppose an illustrative normalized reading is 0.98 with a stated uncertainty range of plus or minus 0.03. That range should be considered using the agreed decision rule; the displayed central value alone is not enough to decide compliance with a narrow band. These are teaching values, not recommended tolerances.
State how uncertainty, short excursions and required stability duration are handled. Do not invent a decision rule after seeing the data. A result can be inconclusive when the method cannot distinguish the relevant alternatives. Improving the measurement can be more useful than repeating the same uncertain test until one run happens to look acceptable.
Retain a reproducible data package
Save the approved question, reference preparation, calibration and blank checks, sampling layout, timing definition, raw measurements, processing steps, repeat results, deviations, and conclusion. Identify the instrument and calculation versions. A future reviewer should be able to reproduce the interpretation without reconstructing undocumented operator choices.
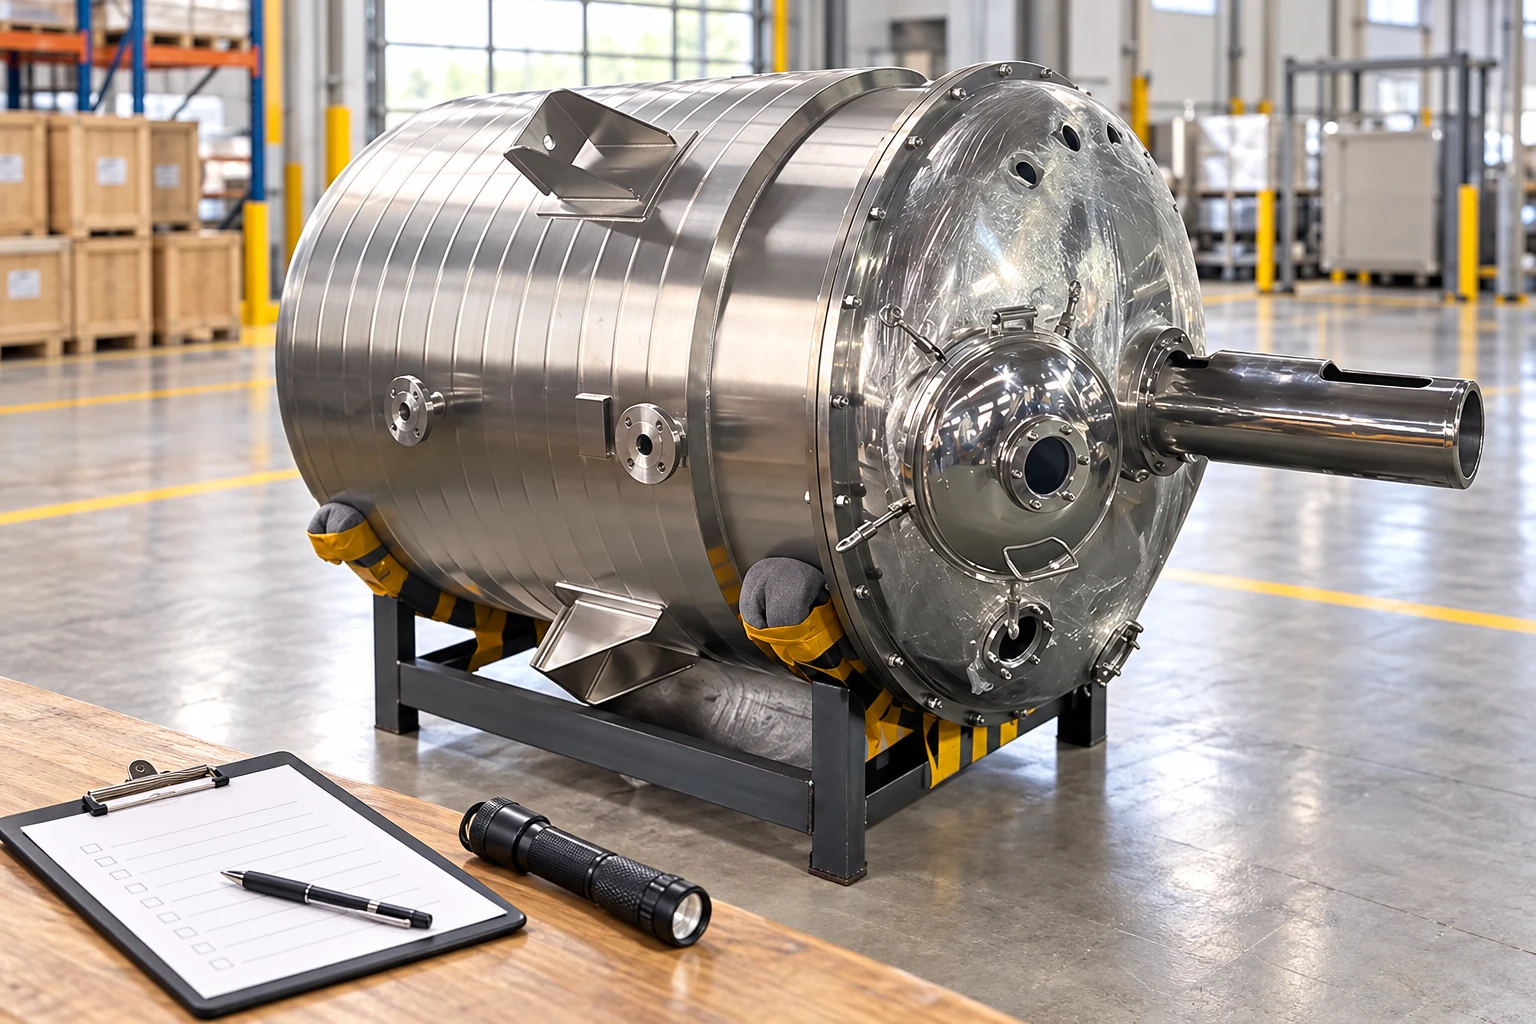
Para un variable-speed mixing tank, explain these measurement requirements before agreeing a performance trial. The product photograph identifies the vessel’s visible configuration, not an installed conductivity system or a measured result. Review the evidence again when formulation, sample route, instrumentation or scale changes; the mixing scale-up guide addresses that separate change in process conditions.
Further learning: conductivity meter calibration
Milwaukee Riverkeeper demonstrates calibration of a specific conductivity meter for water monitoring. Use it to understand reference-solution handling and instrument checks. This is an instrument-specific water demonstration, not a validated tracer recipe or an acceptance procedure for a production mixing tank.
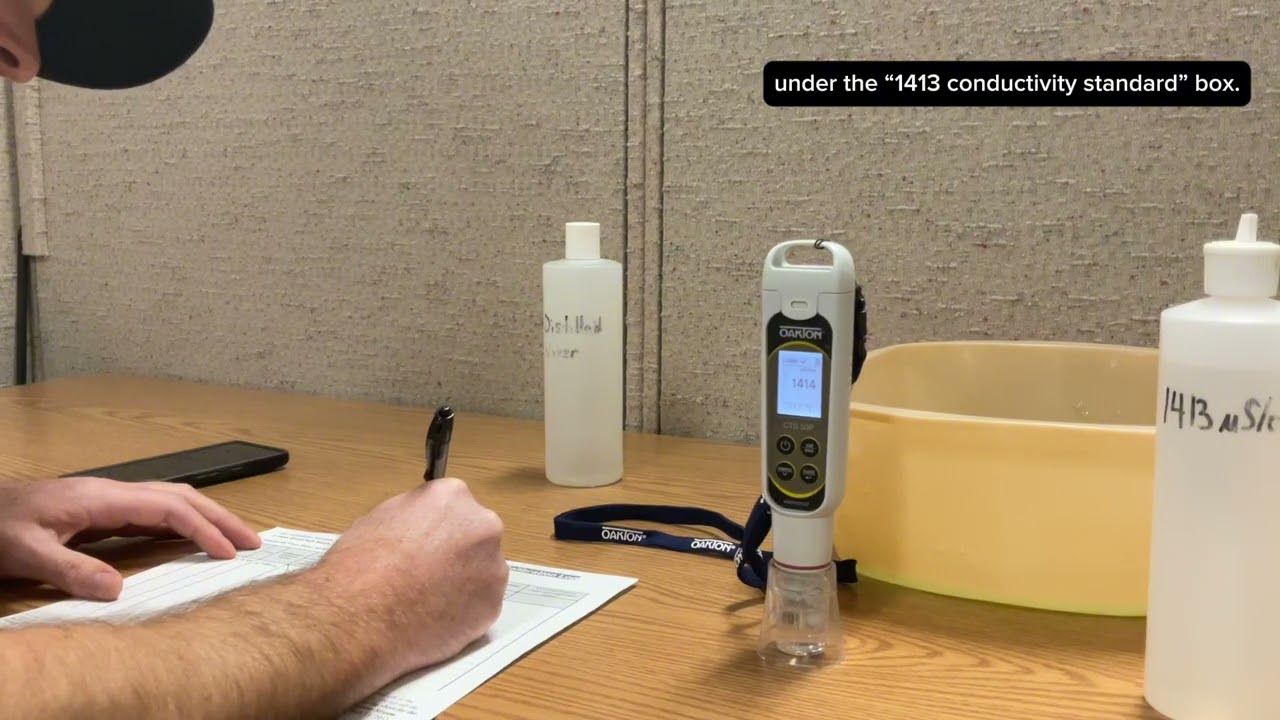
Watch Calibrate OAKTON CTS 50P Specific Conductivity Meter by Milwaukee Riverkeeper
Preguntas frecuentes
Does a stable conductivity reading prove that the whole tank is mixed?
No. It represents the measurement location and method. Verify the concentration relationship, temperature behavior, sampling route and spatial coverage before interpreting it as broader uniformity evidence.
Can sample-line residence time simply be subtracted from the result?
Only when the correction is justified for the actual route and measurement method. Dispersion, variable flow and uncertain timing can make a single nominal delay an inadequate correction.
What should be done when two repeated tests disagree?
Preserve both runs and investigate the addition, starting condition, sampling route and instrument checks. Do not average away a known deviation or select only the more favorable curve.